Most stores know their overall conversion rate. Far fewer know how their search converts, which queries fail, or how much revenue flows through the search bar. Yet searchers are often the highest-intent visitors on the site. These 10 metrics tell you whether search is helping or hurting, and which fixes to make first.
Before you start: turn on search tracking
Google Analytics 4 can record site searches automatically. In your GA4 data stream, open enhanced measurement and make sure "Site search" is on. GA4 detects common query parameters such as q, s, search, query and keyword, and you can add your own. Each search is then logged as a view_search_results event with the search term.
That gives you search volume and terms. For the deeper metrics below, such as clicks on results and revenue per search, you'll need either custom events or a search platform with built-in analytics.
1. Search usage rate
The share of sessions that include at least one search. Formula: sessions with a search ÷ all sessions. Low usage can mean the search box is hard to find, especially on mobile, or that shoppers don't trust it. Compare usage on desktop and mobile separately.
2. Search conversion rate
The share of sessions with a search that end in a purchase. Formula: sessions with a search and an order ÷ sessions with a search. Compare it with the conversion rate of sessions without search. Searchers usually convert higher; if yours don't, search is probably failing them.
3. Revenue per search
Total revenue from sessions with a search ÷ number of searches. This is the best single number for judging search changes, because it captures both relevance and merchandising. Use it as the main goal for A/B tests.
4. Zero-result rate
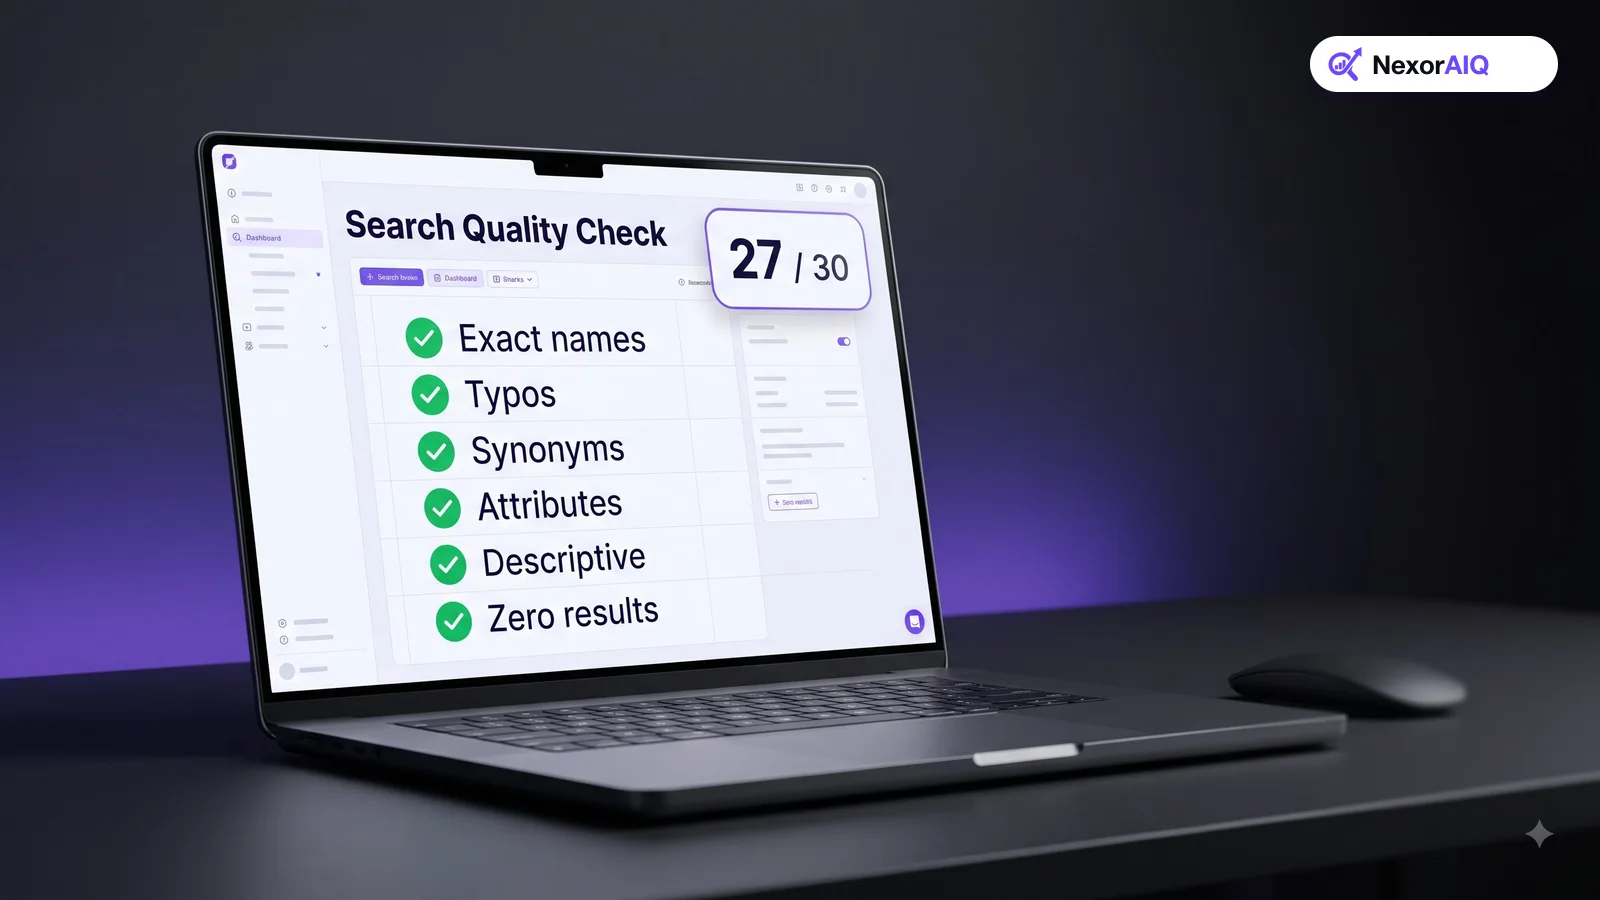
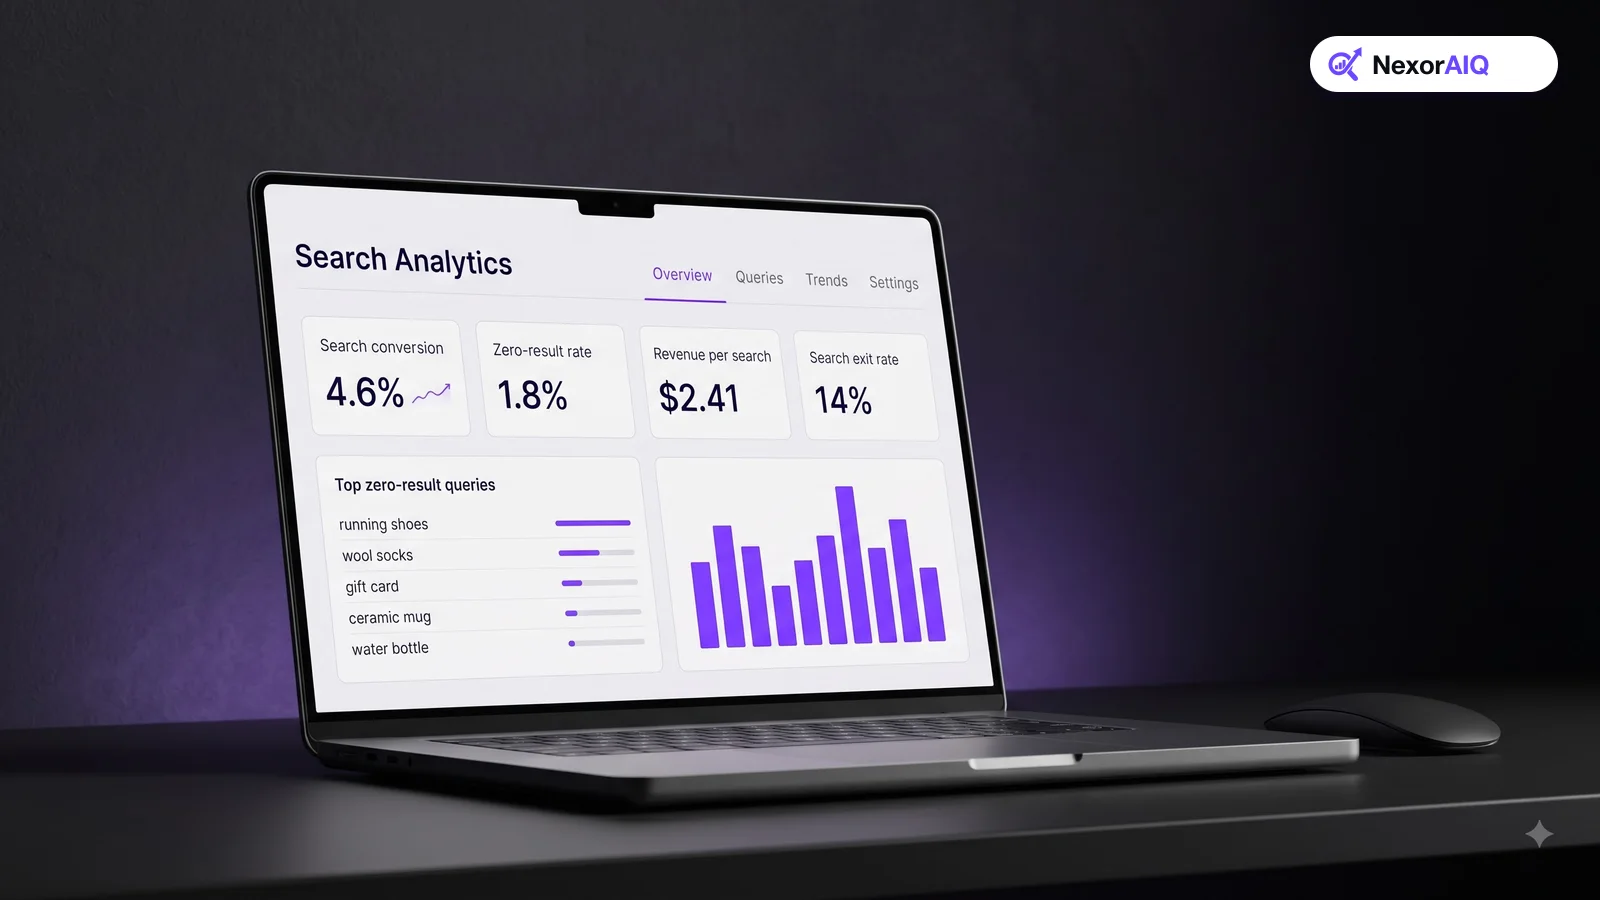
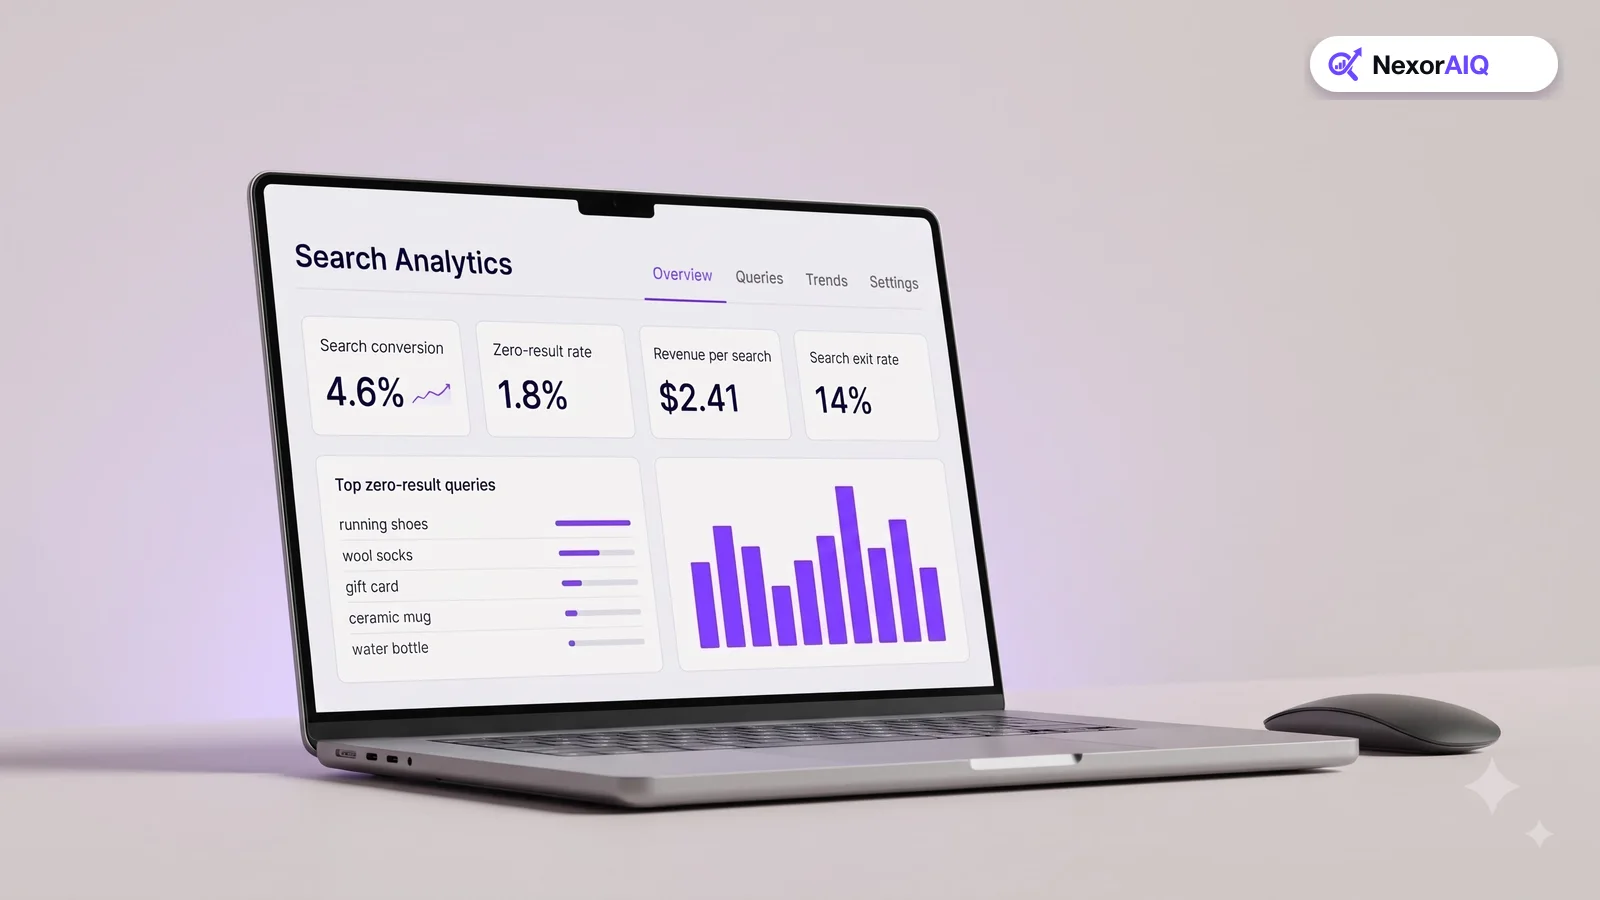
The share of searches that return no products. Formula: searches with zero results ÷ all searches. Every zero-result search is a shopper you're turning away. Review the top zero-result queries every week; most can be fixed with synonyms, spelling corrections or a missing product. See our zero-result recovery guide.
5. Search exit rate
The share of searches after which the shopper leaves the site without clicking anything. A high exit rate on a specific query means the results look wrong, even if there are plenty of them. Sort queries by exits, not just by volume.
6. Search refinement rate
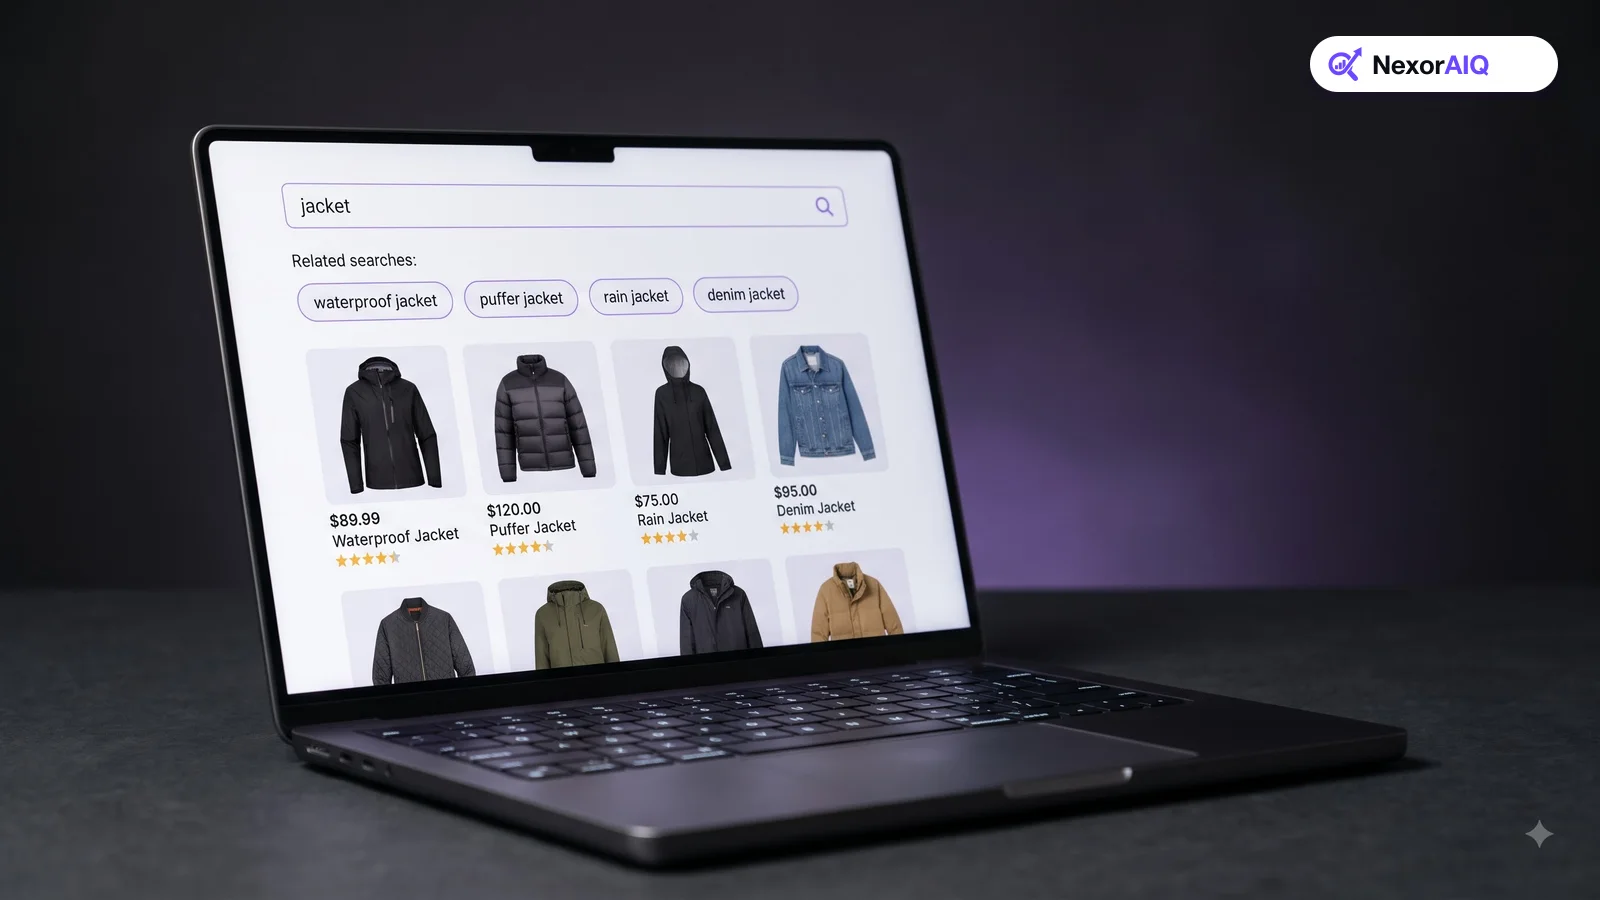
The share of searches followed immediately by another search. Some refinement is normal, but a high rate means shoppers aren't finding what they want on the first try. Look at the pairs: if "sofa" is often followed by "couch", you have a synonym gap.
7. Result click-through rate
The share of searches where the shopper clicks at least one result. Formula: searches with a result click ÷ all searches. It's the quickest signal of relevance. If the click-through rate for a high-volume query is low, check what's ranked in the top four positions.
8. Average click position
The average position of the result shoppers click. If shoppers routinely click results 8 or 12, your best products are ranked too low. For your top queries, you want most clicks in the first row of results.
9. Filter usage rate
The share of searches where shoppers apply a filter. High filter use on broad queries is healthy. High filter use on specific queries can mean results are too noisy. Also track which filters are used most, and move them to the top of the panel. More in our filter best practices.
10. Top query coverage
How much of your search volume comes from your top 100 queries, and how well each of them performs. Usually a small set of queries makes up a big share of searches. Make sure every one of them returns strong, merchandised results, then work down the long tail.
A weekly search review in 30 minutes
Metrics only help if someone looks at them. Book a 30-minute weekly review:
- Check the trend in search conversion rate and revenue per search.
- Fix the top 10 zero-result queries.
- Open the 5 high-volume queries with the highest exit rates and look at the results as a shopper would.
- Note any campaign or seasonal queries coming up and prepare results for them.
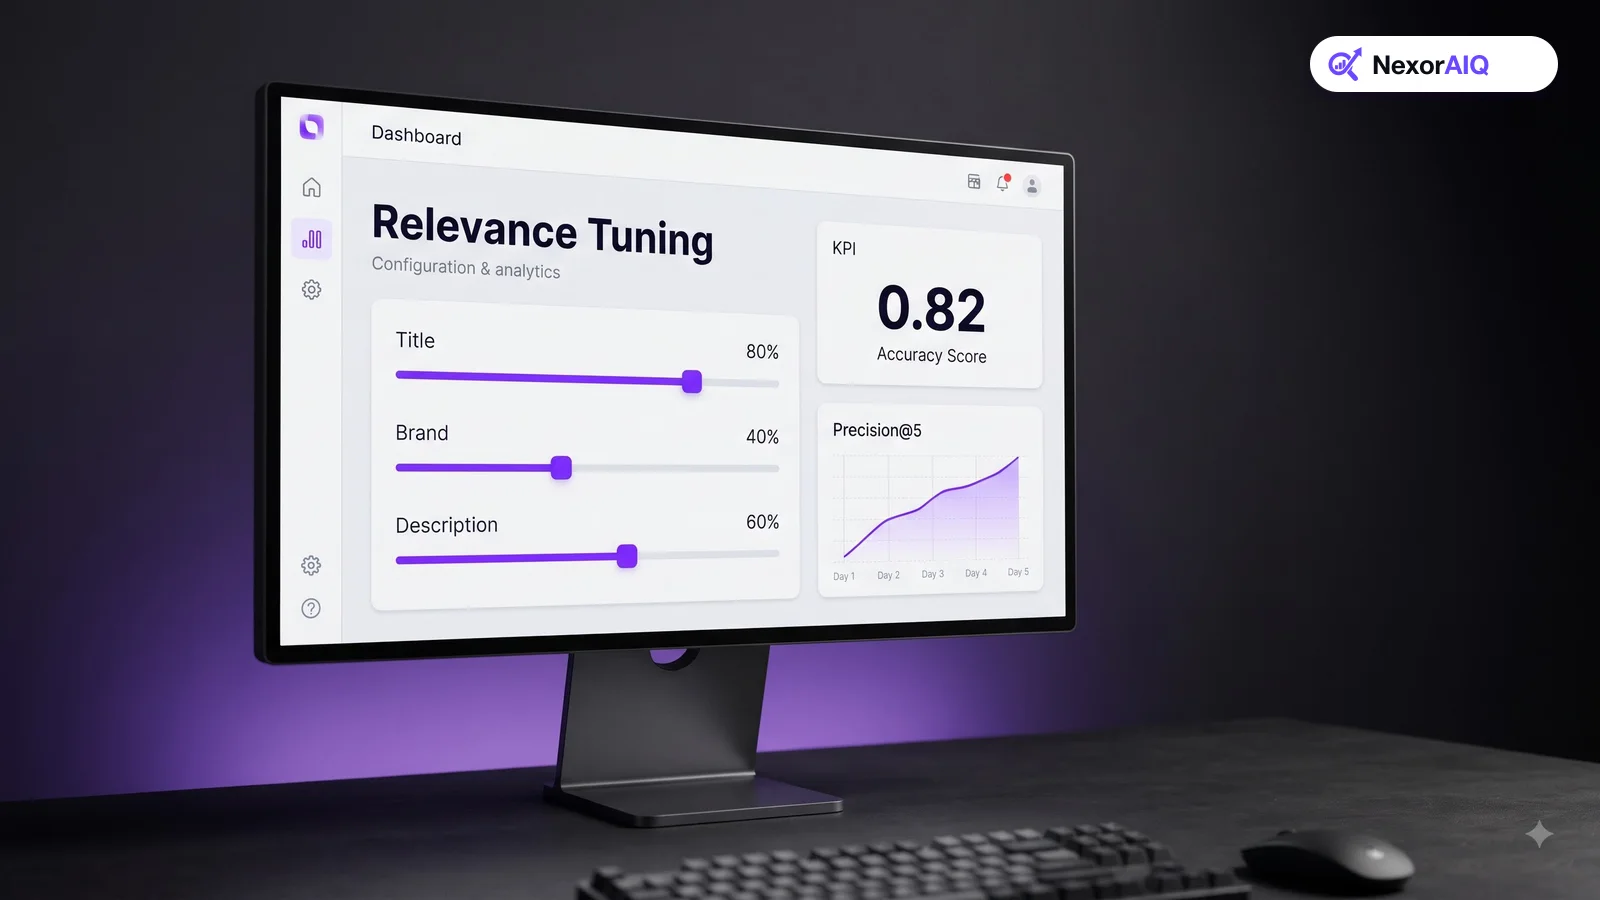
NexorAIQ's AI Search Optimizer and search analytics surface these lists automatically, so the review takes minutes rather than an afternoon of spreadsheets.
Ecommerce search metrics cheat sheet
| Metric | Formula | What to watch for |
|---|---|---|
| Search usage rate | Sessions with search ÷ all sessions | Low on mobile: search box hard to find |
| Search conversion rate | Search sessions with order ÷ search sessions | Not higher than non-search sessions |
| Revenue per search | Search session revenue ÷ searches | Main goal for tests |
| Zero-result rate | Zero-result searches ÷ searches | Keep well under 5% |
| Search exit rate | Searches then exit ÷ searches | High on specific high-volume queries |
| Refinement rate | Searches followed by a search ÷ searches | Synonym and relevance gaps |
| Result click-through rate | Searches with a click ÷ searches | Low on top queries |
| Average click position | Mean position of clicked results | Clicks far down the page |
| Filter usage rate | Searches with a filter ÷ searches | Which filters matter most |
| Top query coverage | Volume share of top 100 queries | Weak results on any top query |
Frequently Asked Questions & Architecture Insights
How do I track site search in Google Analytics 4?
Turn on the Site search option in your data stream's enhanced measurement settings. GA4 then logs a view_search_results event with the search term whenever a results URL contains a recognized query parameter.
What is the most important site search metric?
Revenue per search is the best single measure because it reflects both relevance and merchandising. Zero-result rate is the best metric for finding quick fixes.
How often should I review search analytics?
Weekly is enough for most stores. Check trends, fix top zero-result queries, and inspect high-exit queries. Review more often during big campaigns and peak season.
Key Takeaway
Search analytics turn the search bar from a black box into a list of fixes. Start with tracking in GA4, watch zero-result rate and revenue per search, and run a short weekly review. The stores that improve search fastest are the ones that look at it every week.